Creating a new Dashboard - Google Sheets
NOTE - Before creating a Dashboard, please ensure you have linked your Integrations to the Client
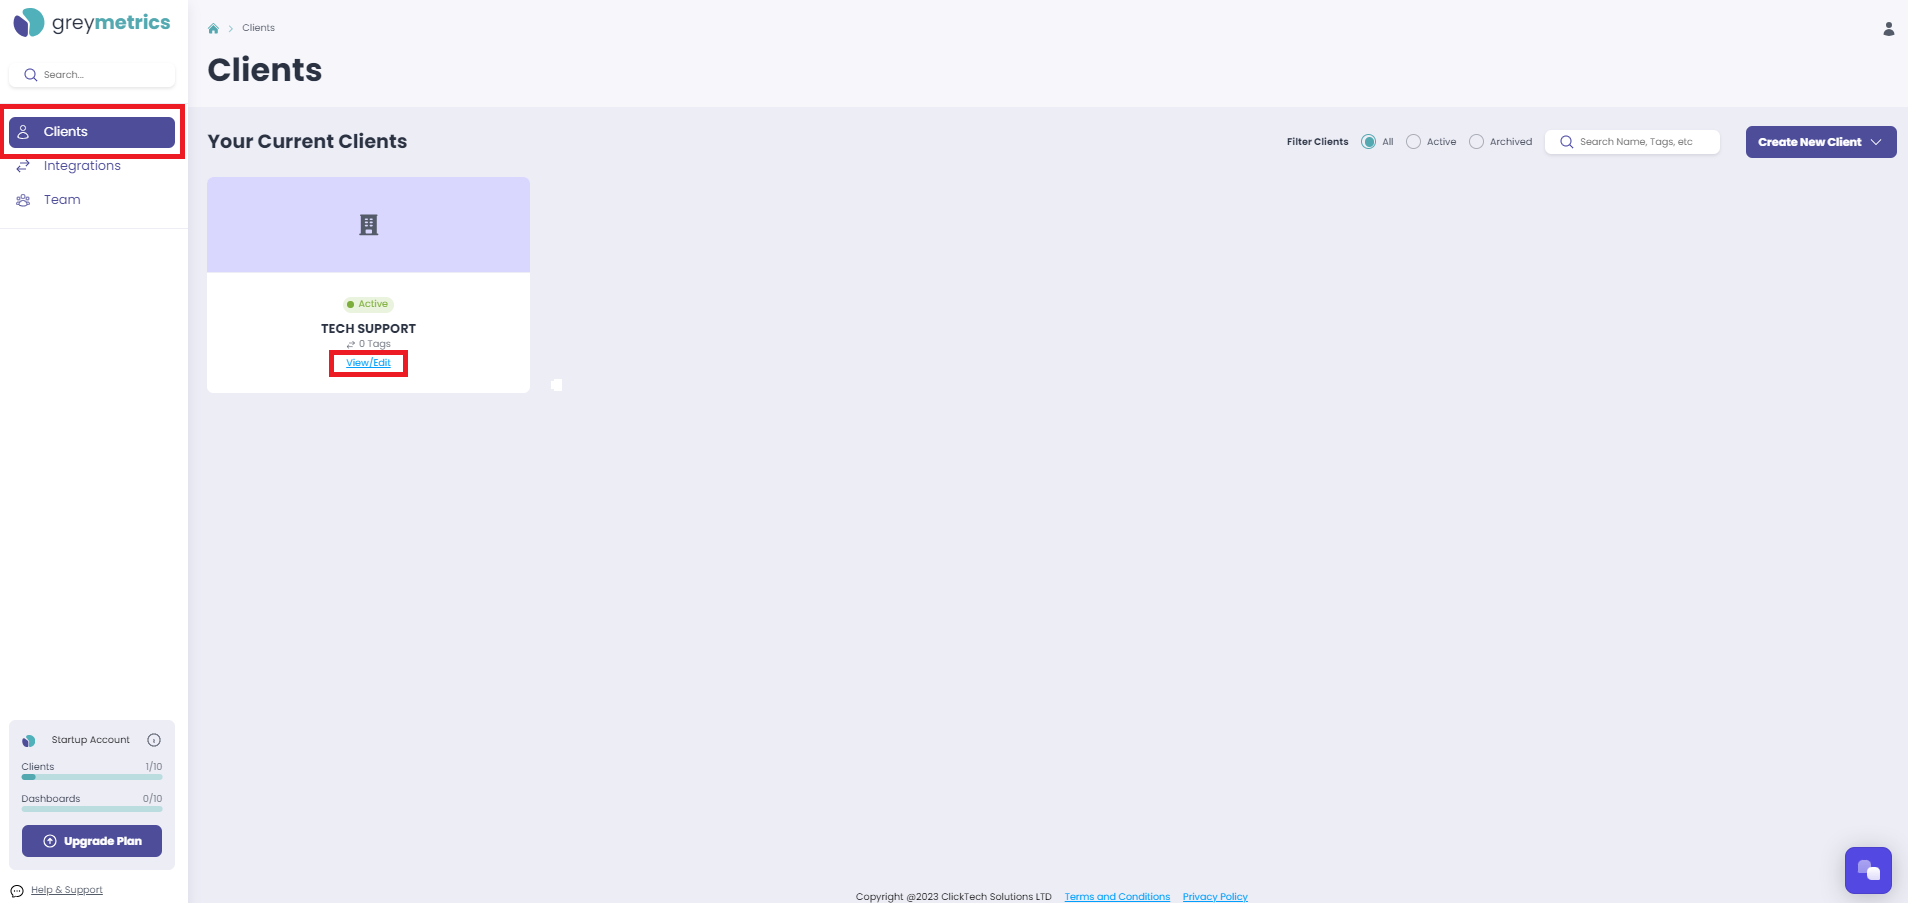
'Select ‘Clients’ from the menu on the left hand side of the page, then 'View/Edit ' the Client you wish to work with:
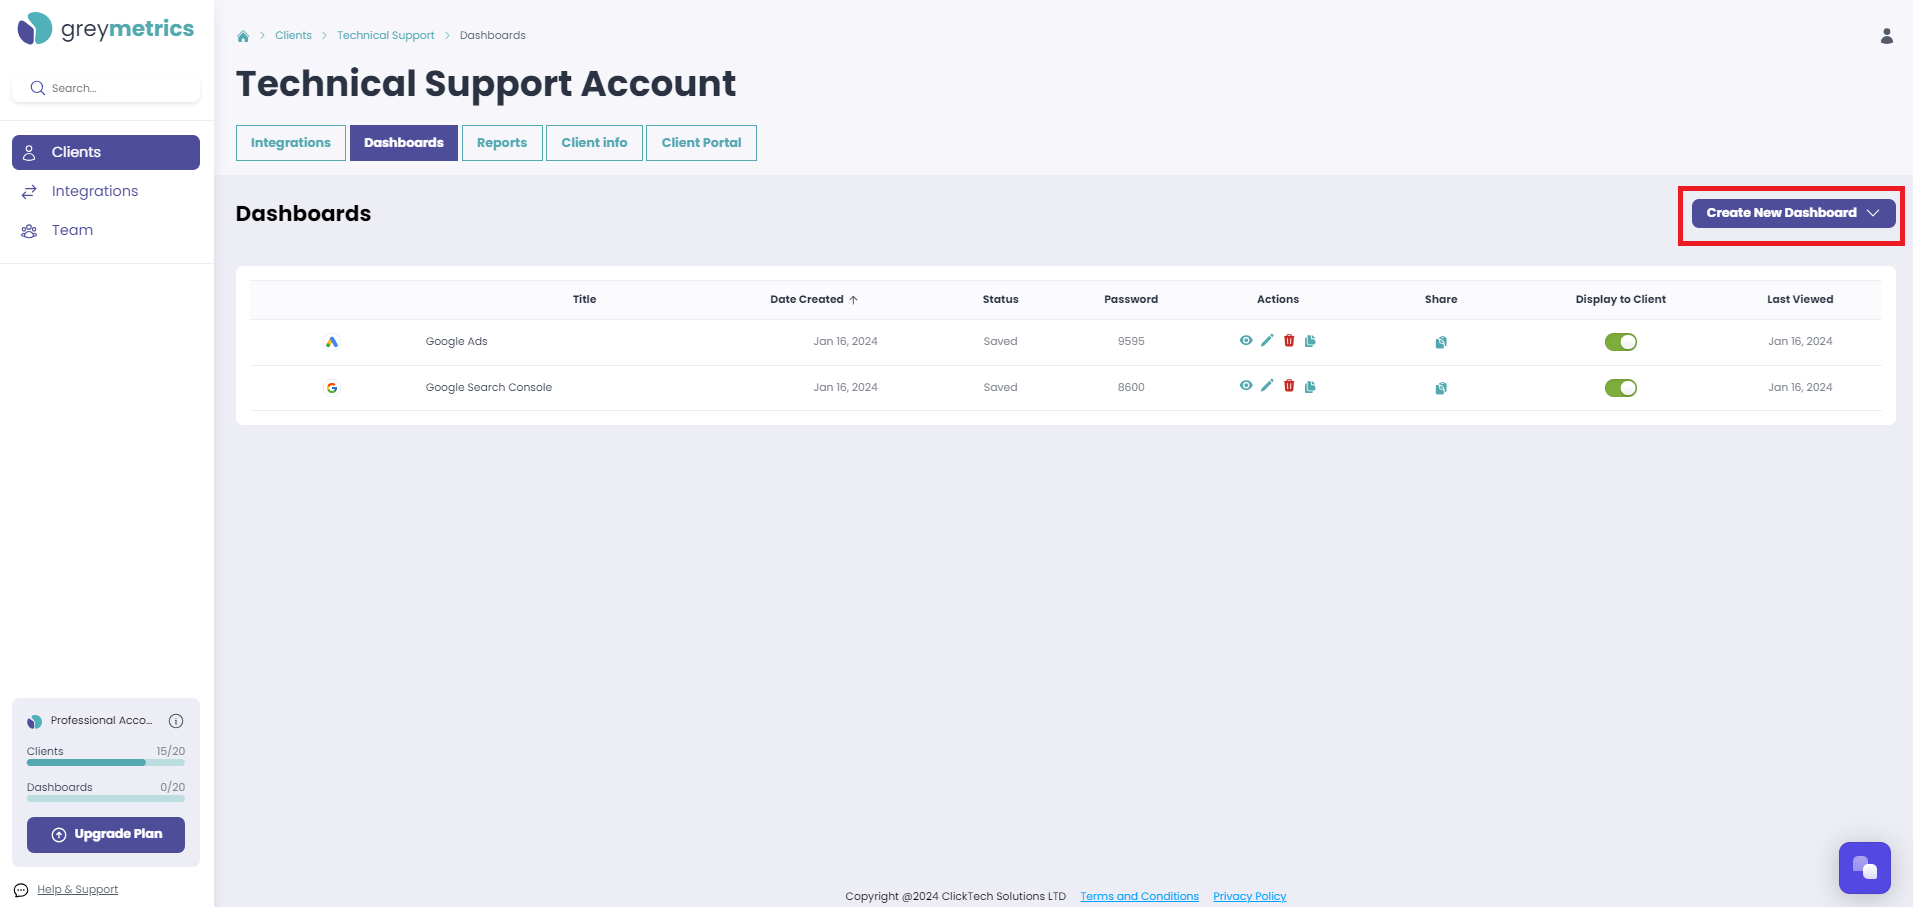
Select the 'Dashboards' tab, and then on the right hand side of the page 'Create New Dashboard':
Next, selecting 'Use a Template' and in the 'Additional Tools Reports', select Google Sheets. Click 'Choose this Template' and your new Report will be generated;
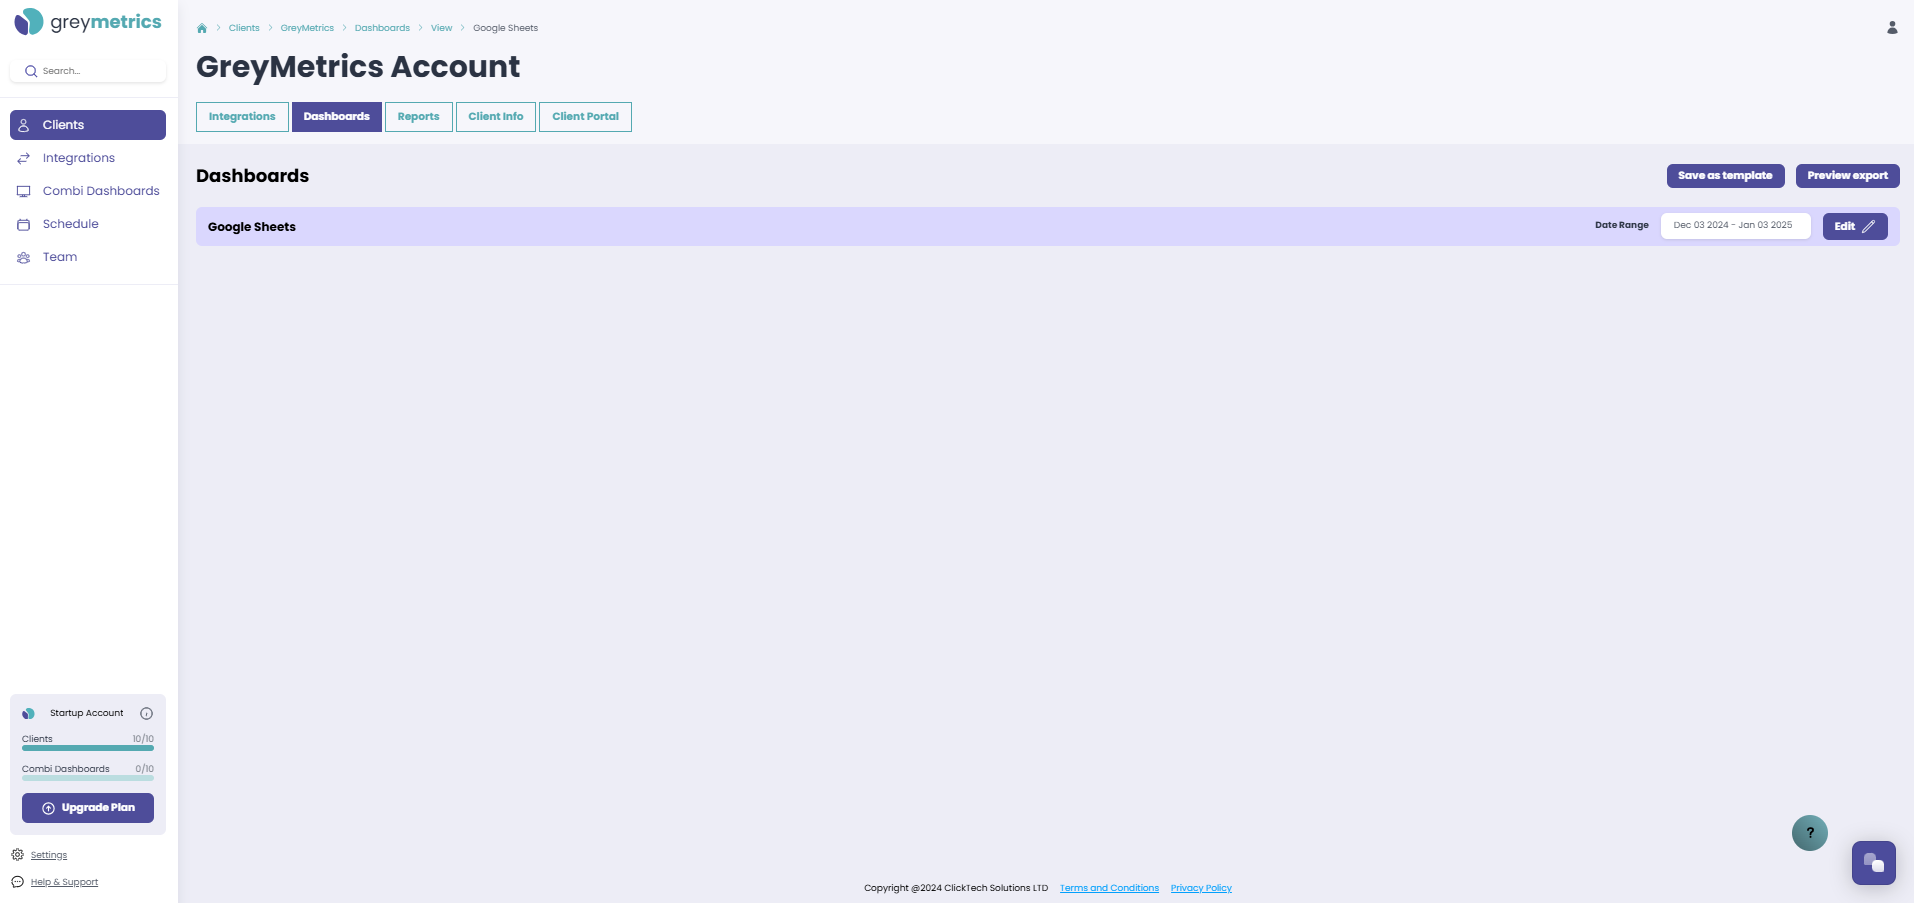
Now select 'Edit' at the top right of the screen
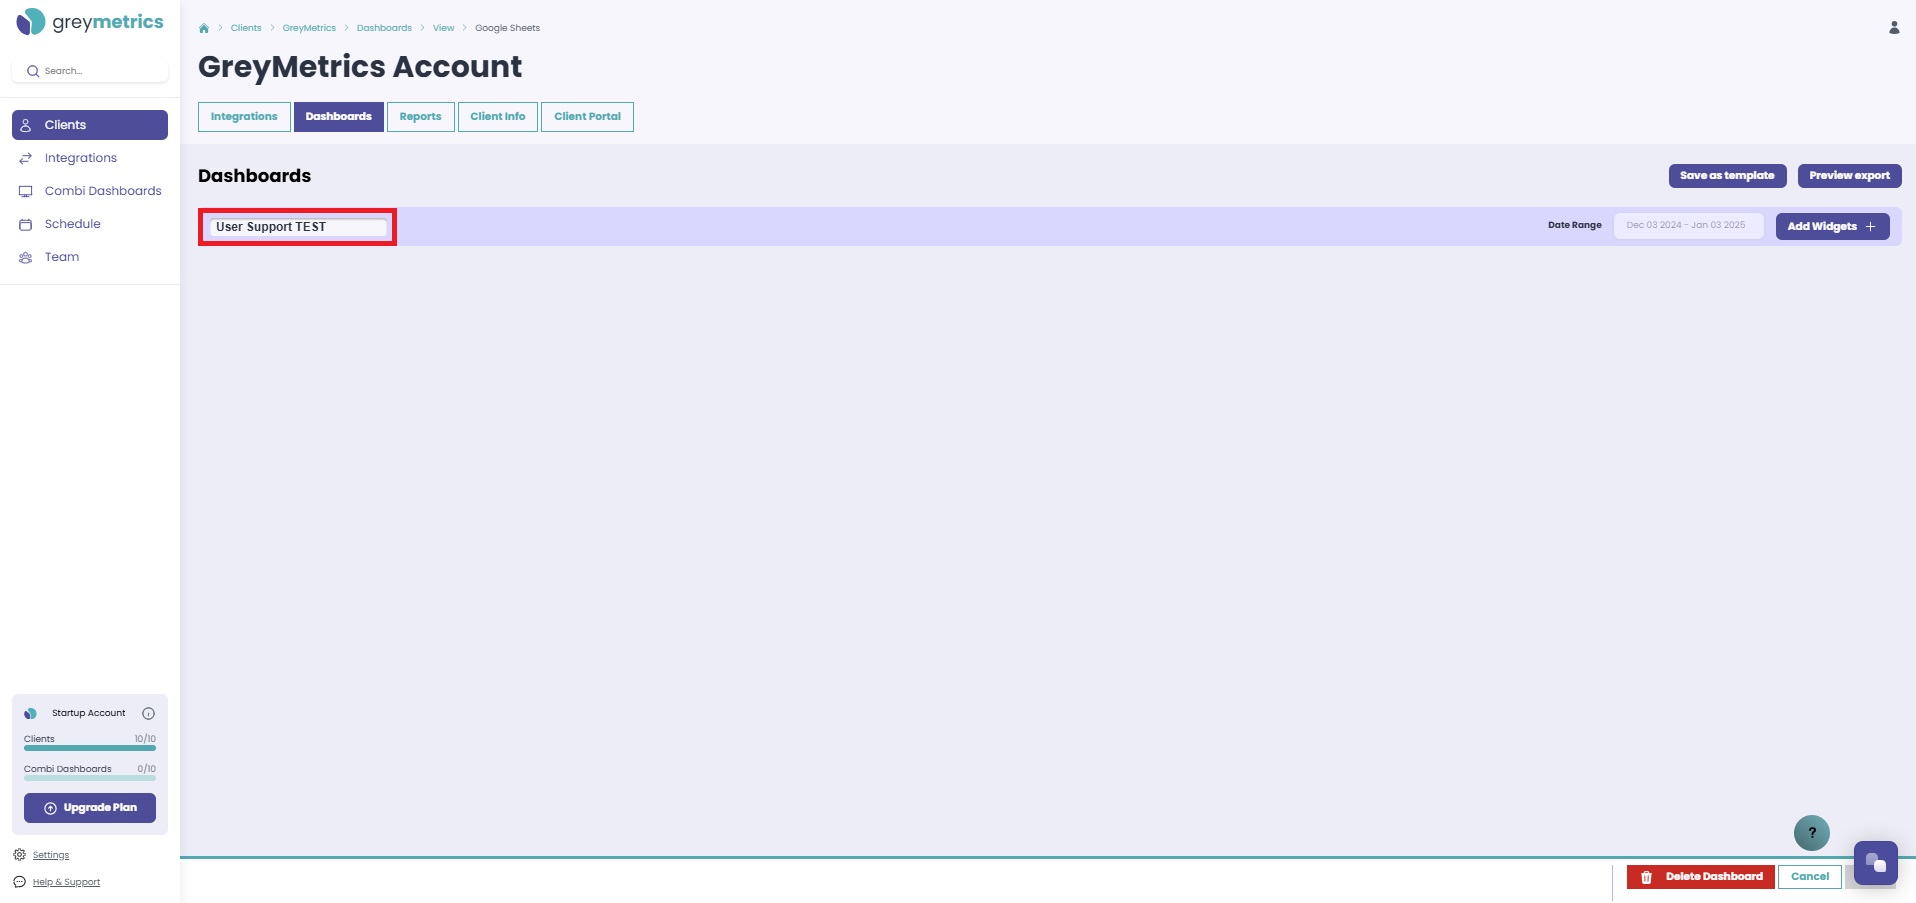
Name your new Dashboard
Click the current name of your Dashboard (Google Sheets) to enter the new name of your choice and confirm by clicking 'Save';
Add Widgets
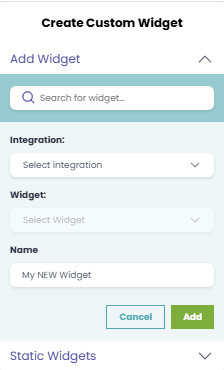
When you select the Integration Google Sheets, the option to select the spreadsheet you wish to use and which tab therein will be presented, as well as the Widget type you wish to present the data in (Card / Pie Chart / Line Chart Bar Chart / Table);
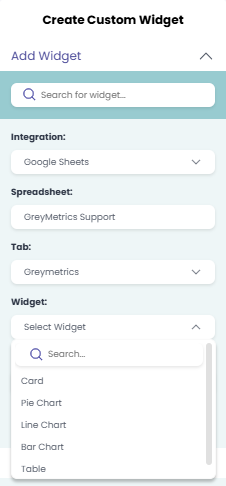
If you select Pie, Line or Bar Chart, you will also then be prompted to select which columns from your Google Sheet you wish to add as Dimensions and Metric columns
Give your new Widget a name, and select 'Add', and it will be added to your Dashboard;
NOTE - New widgets added will contain sample data, save your template by clicking 'Save' at the bottom right of the screen to refresh with you live data
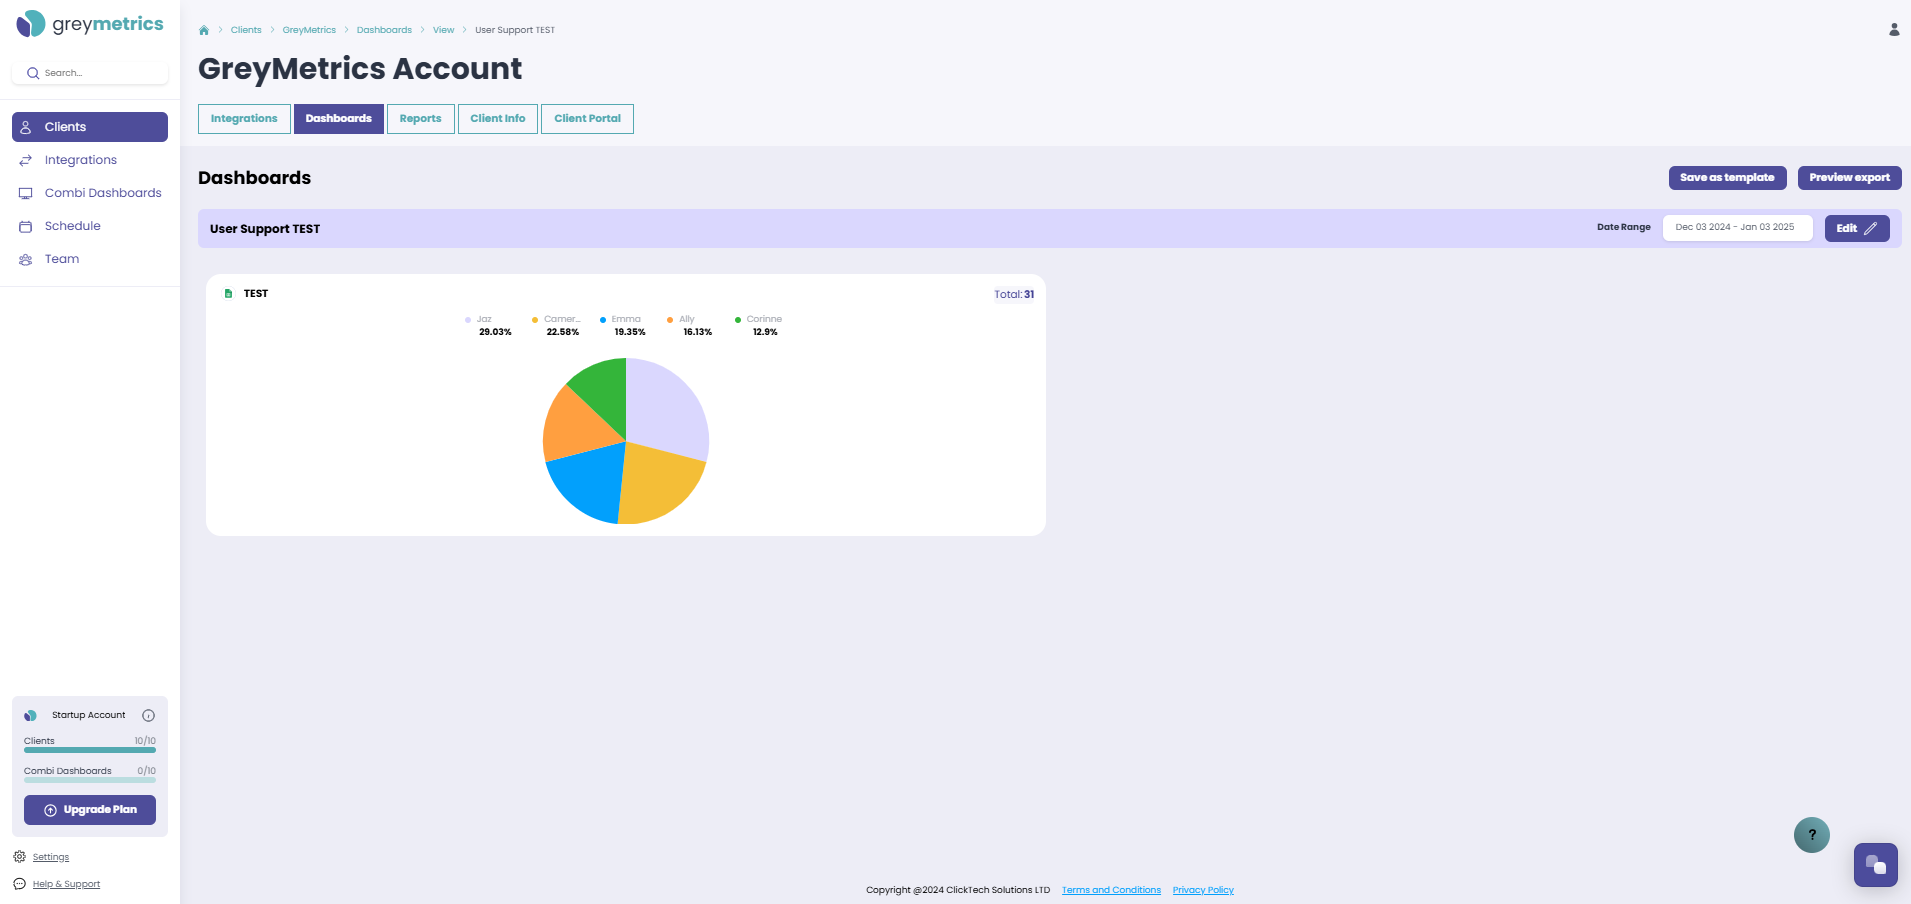
Add Static Widgets
Here you have three options;
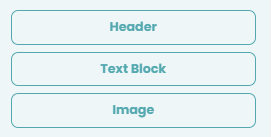
Once added to your Dashboard, click the three dots at the top right of your new widget and select 'Edit' to add your header, text, or image of choice;

Click and drag widgets to display them in your desired format, and then 'Save' at the bottom right of the screen
Repeat the above steps, adding multiple widgets until you are happy with your Dashboard

